- Home >> News >> Research Progress
Research Progress
Boson peak anomaly in glasses gets its orientational order
Atomic vibrations in crystals are well described as lattice waves. At low frequencies, the lattice waves can be treated as continuum elastic waves, and their vibrational density of states (VDOS) can be approximated using the classical Debye squared-frequency law. For glasses lacking long-range periodicity, however, their low-frequency VDOS generally displays an excess over the Debye level, forming the celebrated boson peak (BP). The complex nature of the BP, ranging from extended elastic waves to highly localized modes, constitutes one of the most fascinating problems in condensed matter physics. It has so far remained a major challenge to quantitatively predict the BP from a universal parameter rooted in the glassy structure. Using molecular dynamics simulations, Jiang and his colleagues discovered a fundamental structure-vibration correlation in glasses. It associates the BP anomaly with a microscopic structural parameter, a vector pointing from the center atom to the farthest vertex of its Voronoi coordination polyhedron. This structurally-informed vector is shown to be the tell-tale orientational order identifying the BP, with predictive power of its intensity and frequency. The quantitative correlation established reveals that the anisotropic vibrations with this type of orientational order may point to the general physical origin of the mysterious BP in glasses.
This work entitled “Structural Parameter of Orientational Order to Predict the Boson Vibrational Anomaly in Glasses” has been published online in Physical Review Letters 122, 015501 on 04 Jan 2019.
The paper link: https://journals.aps.org/prl/abstract/10.1103/PhysRevLett.122.015501
This work was supported by the NSFC (Grant Nos. 11522221, 11790292 and 11672299), the Strategic Priority Research Program (Grant No. XDB22040303), the Key Research Program of Frontier Sciences (Grant No. QYZDJSSW-JSC011) of CAS, and US-NSF-DMR 1505621.
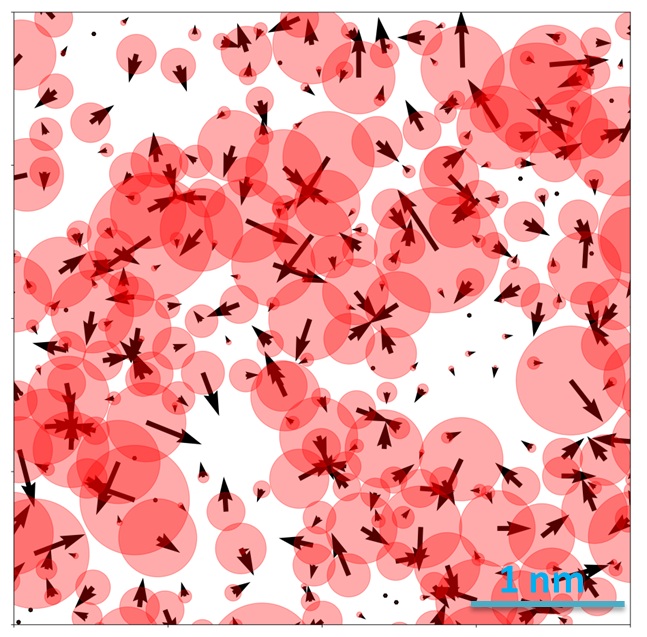
Figure: Spatial distribution of the orientational order (black arrows) for individual atoms (red filled circles). The length of arrows represents the length of orientational order. The size of circles denotes the BP intensity.